QRKM
We connect the physical world to intelligence.
Scroll to travel through a port — from the quay to the edge, the fog and the cloud.
We design and build the intelligent systems that run ports
QRKM: cyber-physical architecture from endpoint to edge to fog to cloud — with AI in every layer, real-time 3D monitoring of the whole port, and foundation models fine-tuned for your operation.
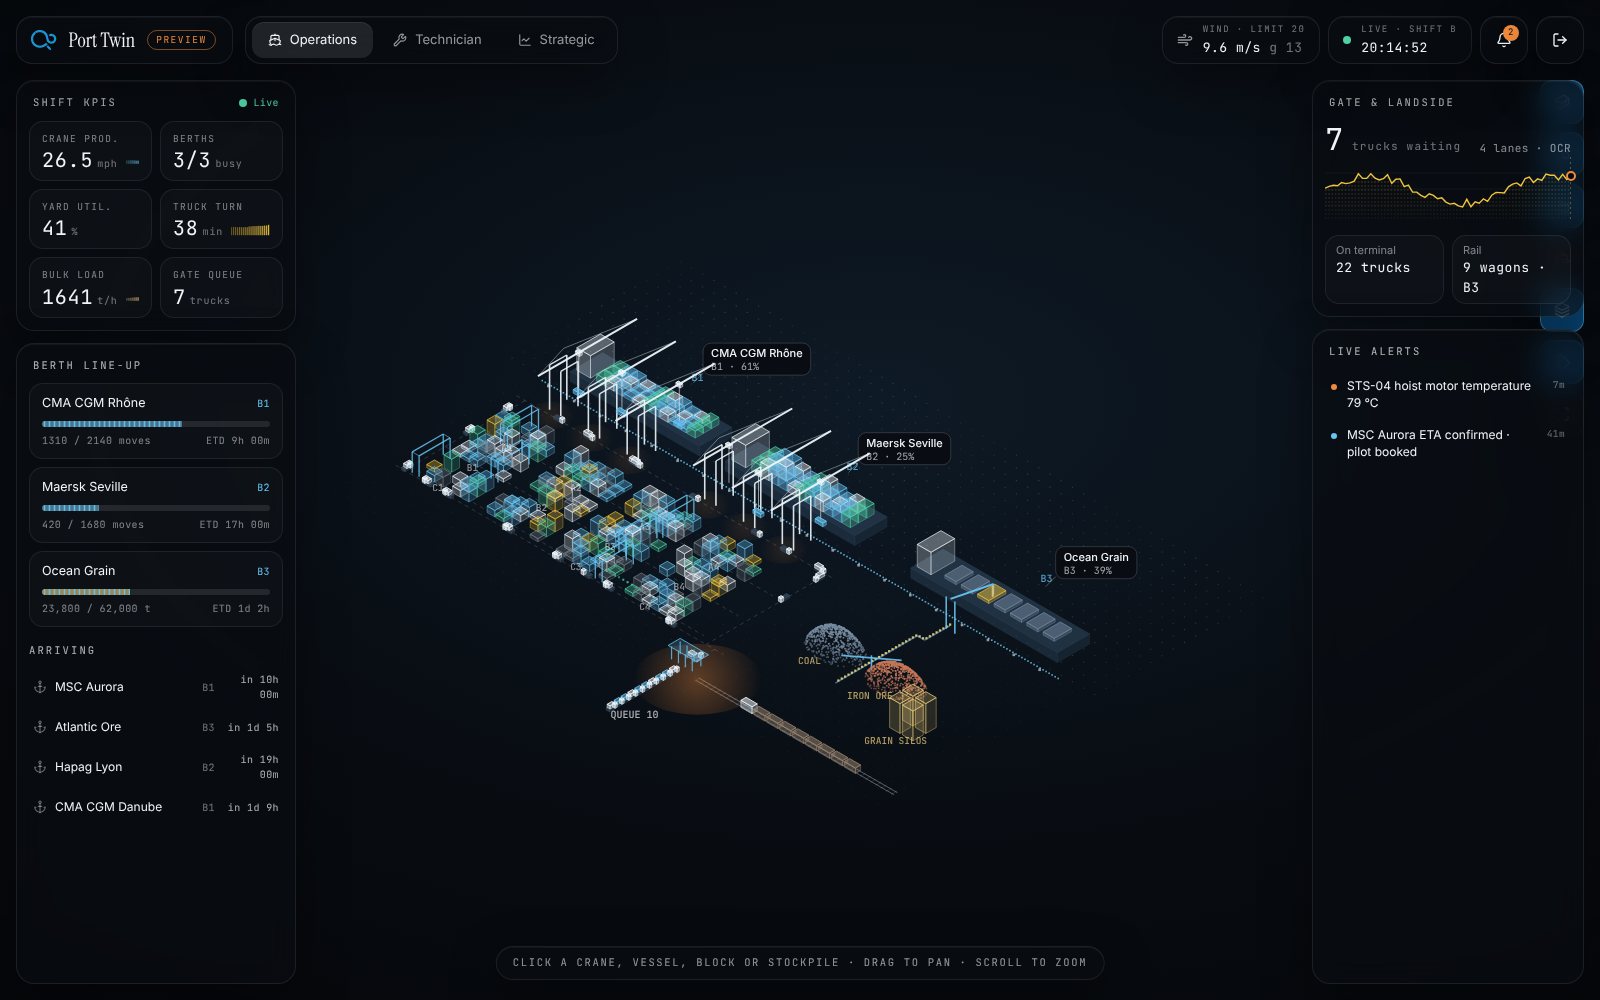
Systems for the operations where physical work and data meet
One system, four layers, AI in each
We are system architects and implementers. Trackers, endpoint devices, HMI monitors, edge gateways, the twin and the BI dashboards are parts of one design — not products sold one by one.
Layer 02
Edge
Compute where the work happens. Operators use HMI monitors that run models locally — querying thousands of containers and bulk trailers without waiting on the cloud.
Cyber-physical systems, connected to foundation models
Transformers, deep learning, statistical and fuzzy systems — chosen for each decision, fine-tuned for each use, and deployed wherever the decision has to be made.
Transformers
Foundation models & LLMs
Large language and vision models connected to live operational data. Retrieval over your own archive, local deployment, and agents that act inside the system — with a person in the loop.
Adaptation
Fine-tuning for specific uses
Foundation models adapted to a port’s vocabulary, documents and rules — from small task models on the edge to adapters on open-weight LLMs.
Reasoning
Fuzzy systems
Decisions where rules are vague and data is noisy: congestion, priority, risk — expressed the way operators actually think.
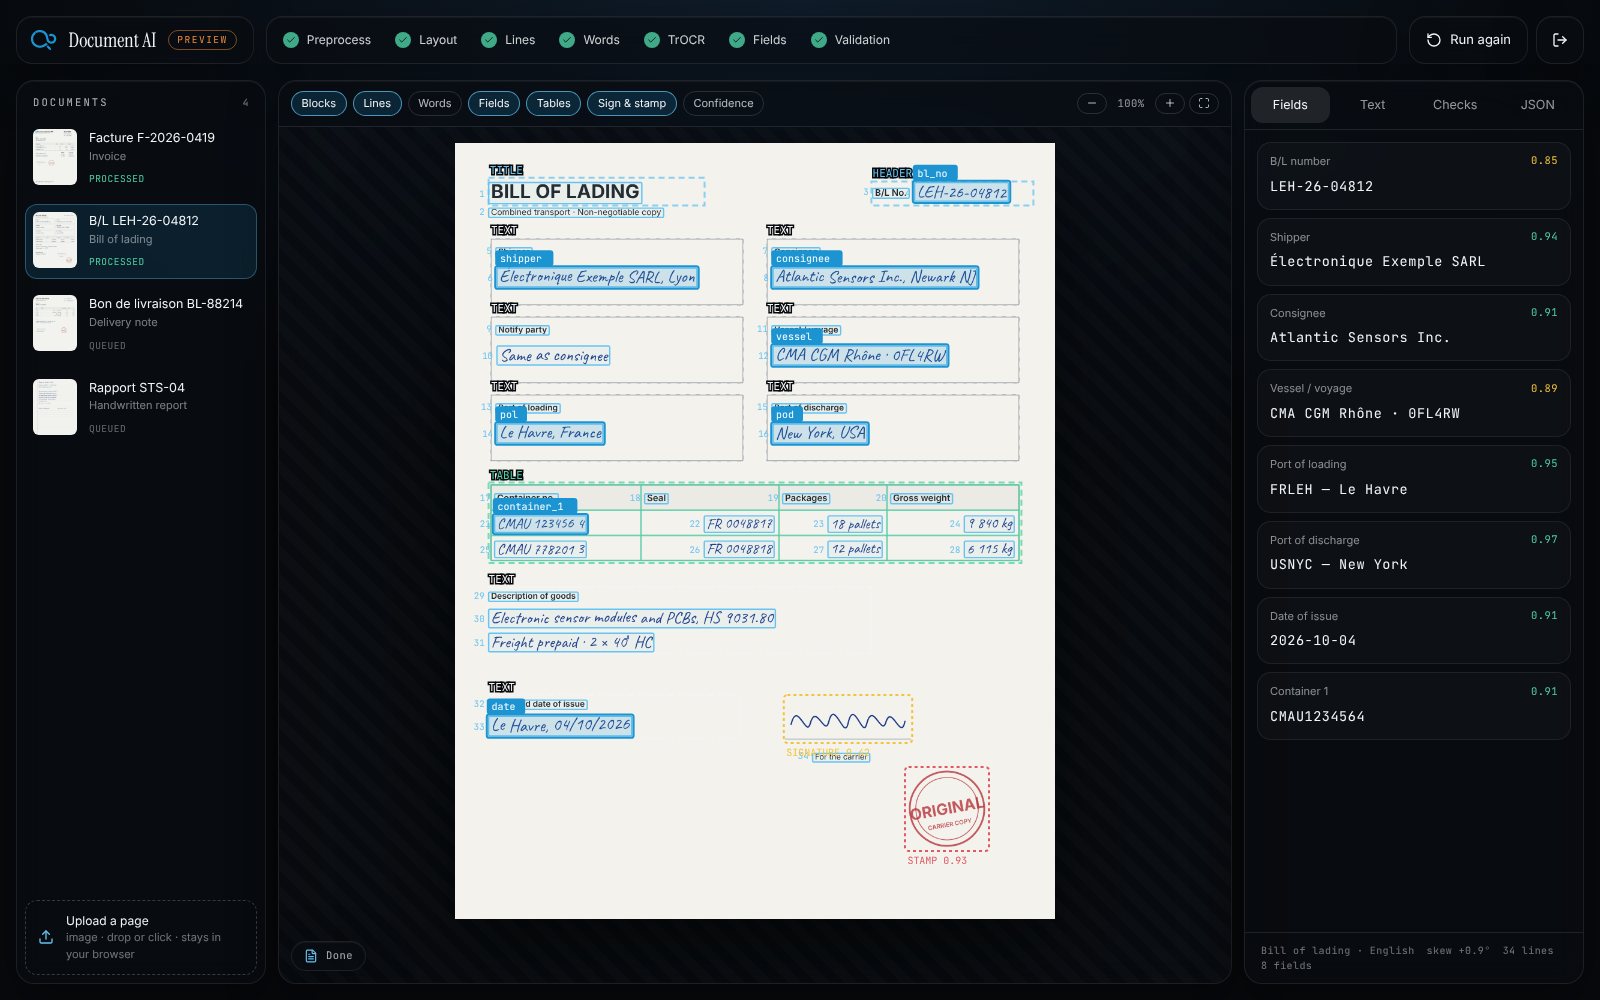
TrOCR · VLM
Transformers that read and see
TrOCR for handwriting and print, vision-language models for photos, drawings and screens — every block, line and word located.
Time series
Deep learning on sensor data
Forecasting arrivals, queues and throughput; detecting anomalies in vibration, temperature and movement.
Inference
Statistical models
Estimation, uncertainty and confidence for every number the system reports — so decisions rest on more than a single prediction.
Operations research
Optimisation
Berth, crane, yard and gate planning that turns live data into better moves, not just better charts.
TinyML · edge inference
Endpoint & edge AI
Models compressed to run on trackers and HMI monitors, deciding locally in milliseconds.
Real-time 3D monitoring, and the optimisation behind it
Every vessel, crane, container, bulk trailer and truck in one live 3D model — and models that turn what it sees into better berth, yard and gate decisions.
Berth plan · next 24 h
Re-planned by the model from live AIS, crane health and yard occupancy
Berth utilisation
87%+6.4
Crane moves / h
31.2+2.1
Truck turn time
38 min−9
ETA forecast error
±22 min−41%
Berths & vessels
Line-up, ETA and progress per vessel; berth plans adjusted as arrivals change.
Quay cranes
Productivity per crane and predictive maintenance from vibration and temperature.
Yard
Stacking, utilisation and moves, optimised with live positions.
Gate & traffic
Truck queues and turn times forecast; lanes balanced before they jam.
Bulk terminal
Stockpiles, conveyors and bulk trailers measured and tracked in real time.
Rail
Wagons and loading in the same picture as quay and gate.
Hardware designed as part of the system
We design the devices the architecture needs — from endpoint trackers to HMI monitors at the edge — so every layer speaks the same language.
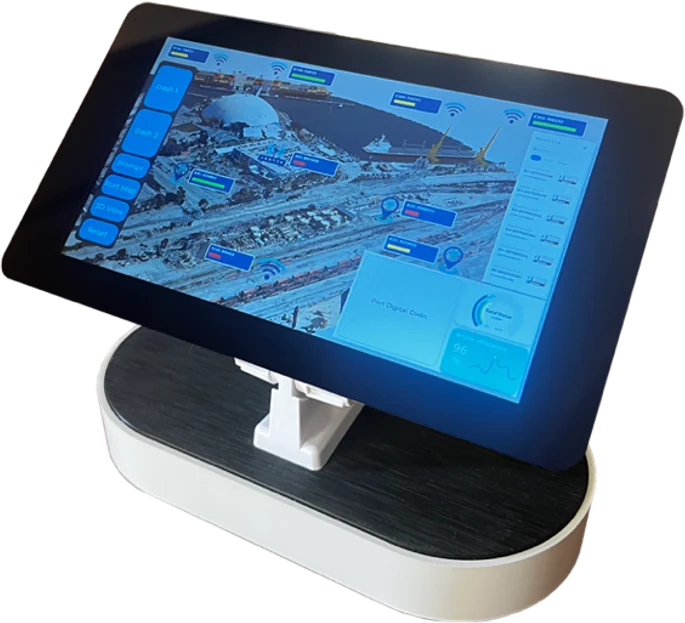
Edge
HMI monitor — Port twin
Touch monitor for the operation: live map, equipment health, dashboards and 3D view of the port.
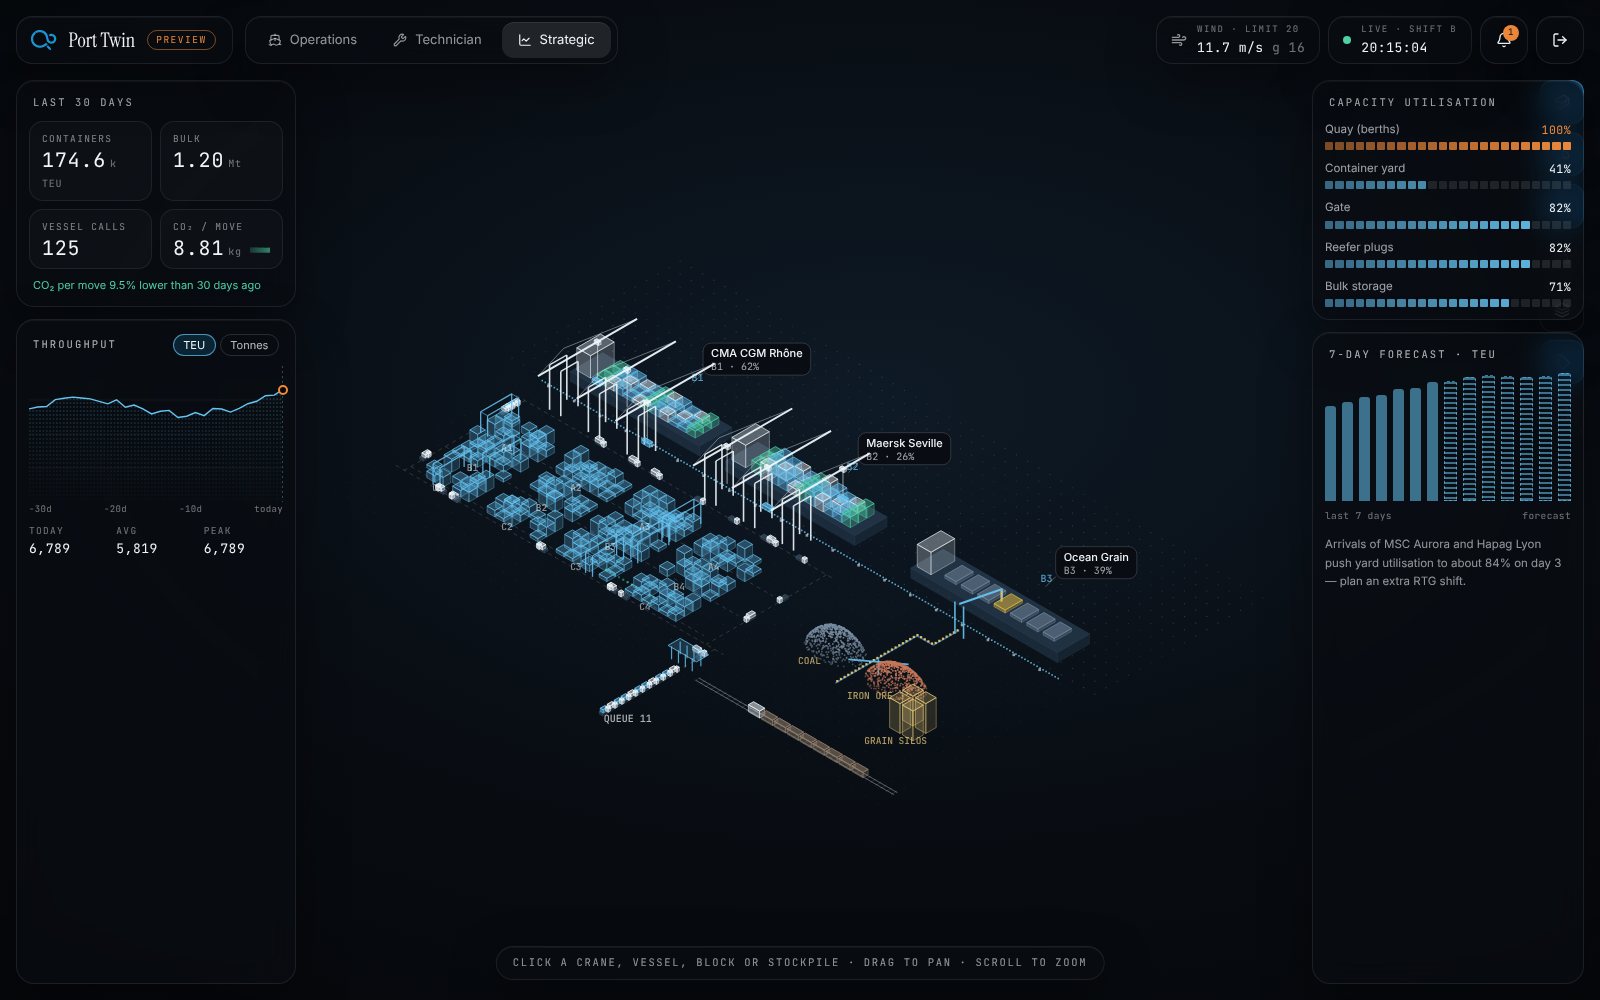
Cloud
BI dashboards
Throughput, capacity, trends and forecasts for the strategic level — fed by every layer below.
Endpoint
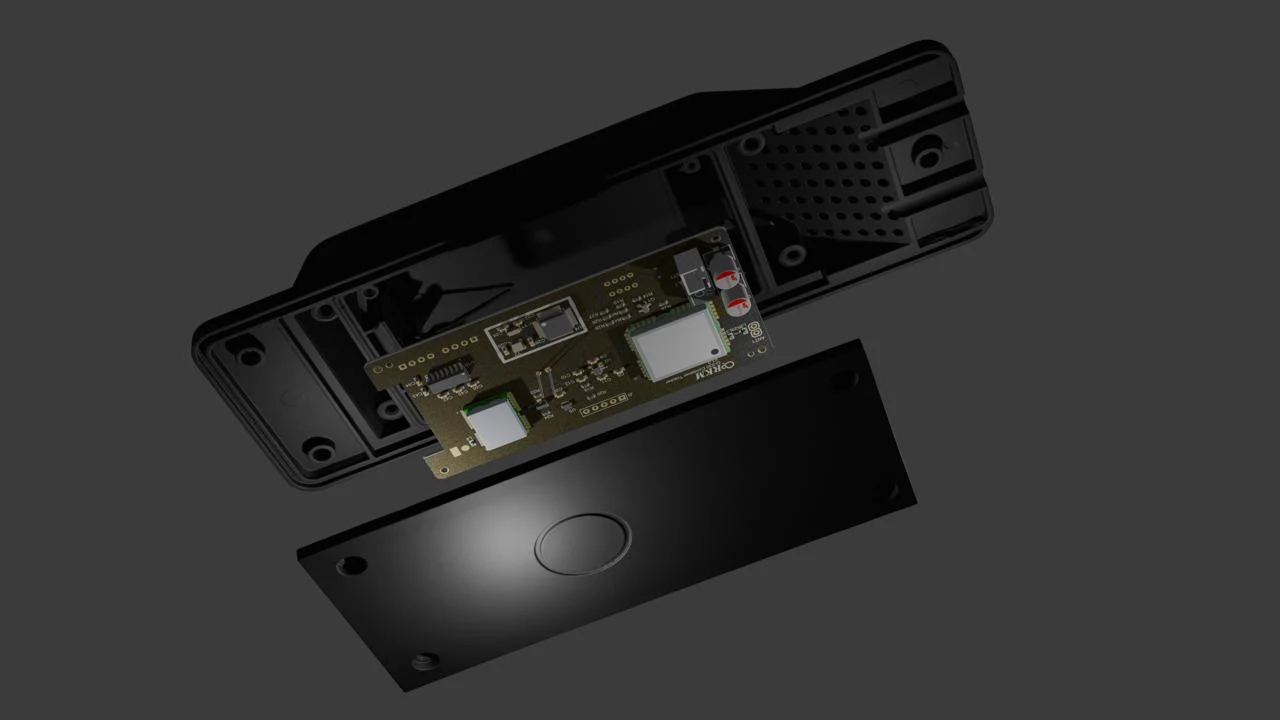
Container trackers
Long-life, IP67 trackers on the container body; the smart version runs an AI model on the device.
Endpoint
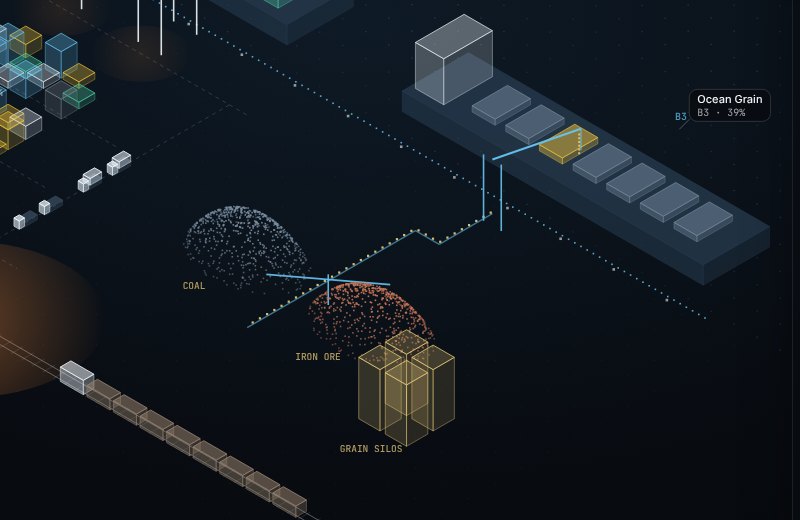
Bulk load tracking
Load, fill and route for bulk trailers, wagons and stockpiles.
From architecture to operation
One team, from the first assessment to the system running — and improving — in production. Since 2019.
- 01
Architecture
Assess the operation, define the layers, data flows and where AI belongs.
- 02
Design
Hardware, firmware, models and platforms designed together.
- 03
Build
Devices, edge software, twin and models built and tested on site.
- 04
Integrate
Connected to existing terminal, ERP and document systems through standard APIs.
- 05
Operate
Monitoring, retraining and support after go-live.
Open them right here
The software layer of the system. Each platform opens in a window on this page; previews run without a server.